Konu özeti
LO27. Constructing research questions that require data collection
Bar charts show information using bars to represent numbers.
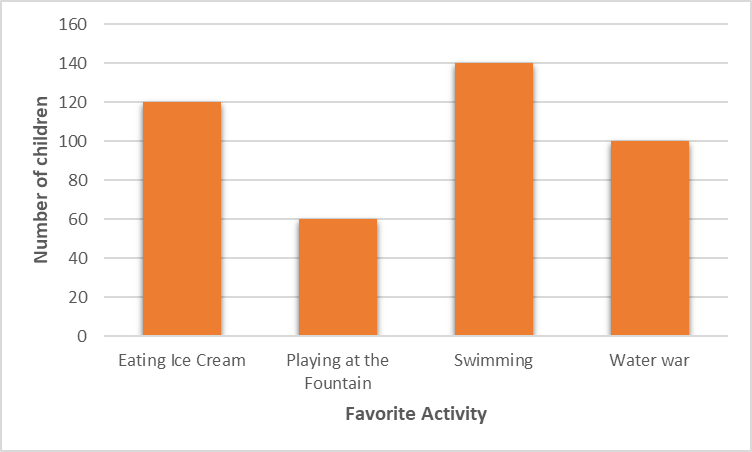
The bar chart below shows how many children chose each activity as their favorite thing to do on a hot day.
The ice cream eating stick is at 120 level, which indicates that 120 children choose to eat ice cream as their favorite activity on hot days.
- Etkinliği tamamlayın
There is no universal set of criteria for a good research question. Different disciplines have different priorities and requirements. A good research question for a history paper will differ from a good research question for a biology paper. In general, however, a good research question should be:
- Clear and focused. In other words, the question should clearly state what the writer needs to do.
- Not too broad and not too narrow. The question should have an appropriate scope. If the question is too broad it will not be possible to answer it thoroughly within the word limit. If it is too narrow you will not have enough to write about and you will struggle to develop a strong argument (see the activity below for examples).
- Not too easy to answer. For example, the question should require more than a simple yes or no answer.
- Not too difficult to answer. You must be able to answer the question thoroughly within the given timeframe and word limit.
- Researchable. You must have access to a suitable amount of quality research materials, such as academic books and refereed journal articles.
- Analytical rather than descriptive. In other words, your research question should allow you to produce an analysis of an issue or problem rather than a simple description of it (more on this below).
- Etkinliği tamamlayın
- Etkinliği tamamlayın
LO28. Collecting data on research questions and displaying data with a frequency table and bar graph
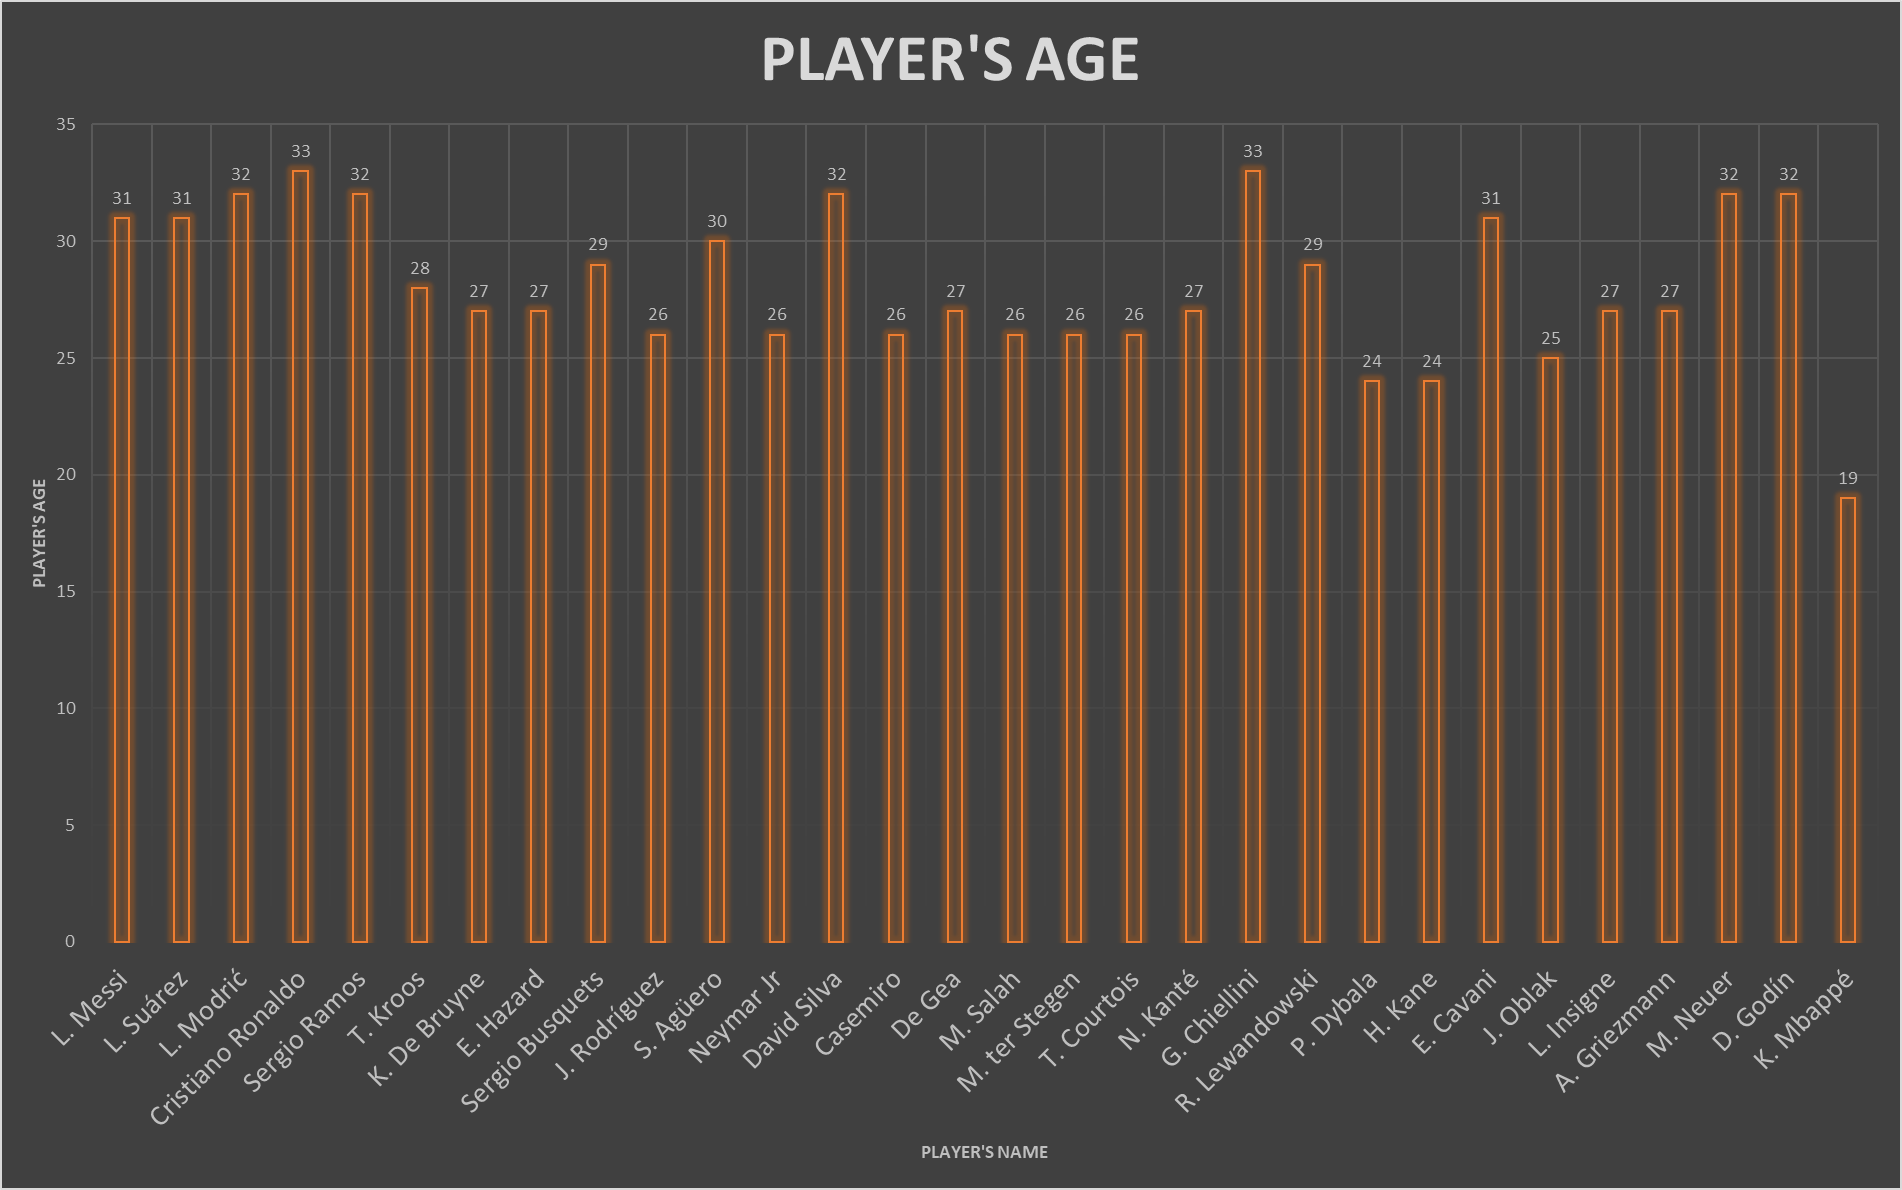
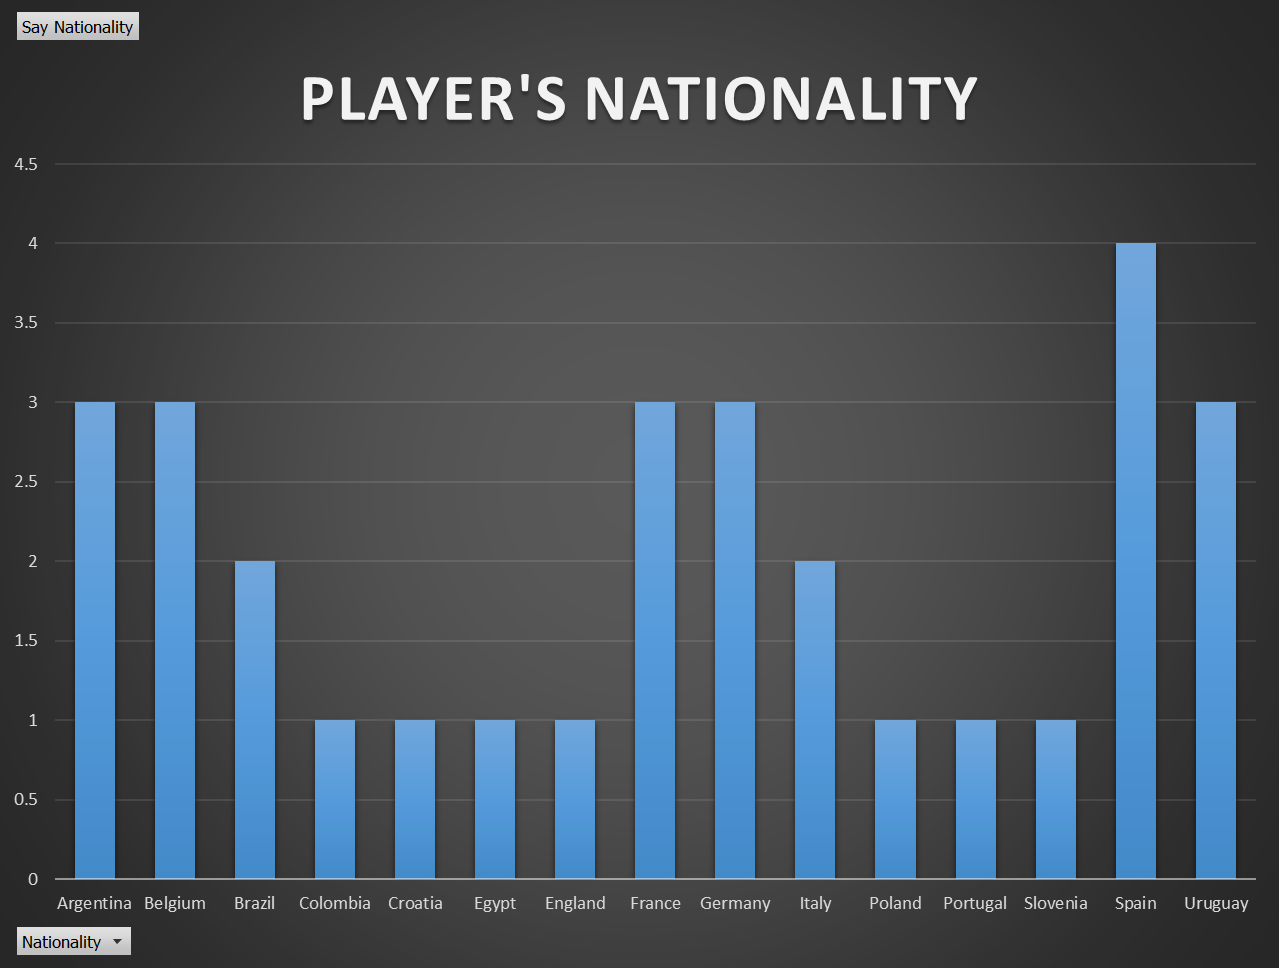
We want to get information about the players in a football game. With this information, let's create events to learn the most expensive, oldest, highest-paid players and their countries with the help of graphics.

LO29. Solving problems requiring interpreting data represented by frequency tables or bar graphs
The datasets provided include the players data for the FIFA. Columns are consist of properties of players. This columns are players nationality, name, age, overall ability score, club, value, weekly wage and preferred foot.;
ID Name Age Nationality Overall Club Value Wage Preferred_Foot 1 L. Messi 31 Argentina 94 FC Barcelona €110.5M 565000 Left 8 L. Suárez 31 Uruguay 91 FC Barcelona €80M 455000 Right 7 L. Modrić 32 Croatia 91 Real Madrid €67M 420000 Right 2 Cristiano Ronaldo 33 Portugal 94 Juventus €77M 405000 Right 9 Sergio Ramos 32 Spain 91 Real Madrid €51M 380000 Right 12 T. Kroos 28 Germany 90 Real Madrid €76.5M 355000 Right 5 K. De Bruyne 27 Belgium 91 Manchester City €102M 355000 Right 6 E. Hazard 27 Belgium 91 Chelsea €93M 340000 Right 21 Sergio Busquets 29 Spain 89 FC Barcelona €51.5M 315000 Right 29 J. Rodríguez 26 Colombia 88 FC Bayern München €69.5M 315000 Left 24 S. Agüero 30 Argentina 89 Manchester City €64.5M 300000 Right 3 Neymar Jr 26 Brazil 92 Paris Saint-Germain €118.5M 290000 Right 14 David Silva 32 Spain 90 Manchester City €60M 285000 Left 28 Casemiro 26 Brazil 88 Real Madrid €59.5M 285000 Right 4 De Gea 27 Spain 91 Manchester United €72M 260000 Right 27 M. Salah 26 Egypt 88 Liverpool €69.5M 255000 Left 19 M. ter Stegen 26 Germany 89 FC Barcelona €58M 240000 Right 20 T. Courtois 26 Belgium 89 Real Madrid €53.5M 240000 Left 15 N. Kanté 27 France 89 Chelsea €63M 225000 Right 25 G. Chiellini 33 Italy 89 Juventus €27M 215000 Left 11 R. Lewandowski 29 Poland 90 FC Bayern München €77M 205000 Right 16 P. Dybala 24 Argentina 89 Juventus €89M 205000 Left 17 H. Kane 24 England 89 Tottenham Hotspur €83.5M 205000 Right 22 E. Cavani 31 Uruguay 89 Paris Saint-Germain €60M 200000 Right 10 J. Oblak 25 Slovenia 90 Atlético Madrid €68M 194000 Right 30 L. Insigne 27 Italy 88 Napoli €62M 165000 Right 18 A. Griezmann 27 France 89 Atlético Madrid €78M 145000 Left 23 M. Neuer 32 Germany 89 FC Bayern München €38M 130000 Right 13 D. Godín 32 Uruguay 90 Atlético Madrid €44M 125000 Right 26 K. Mbappé 19 France 88 Paris Saint-Germain €81M 100000 Right 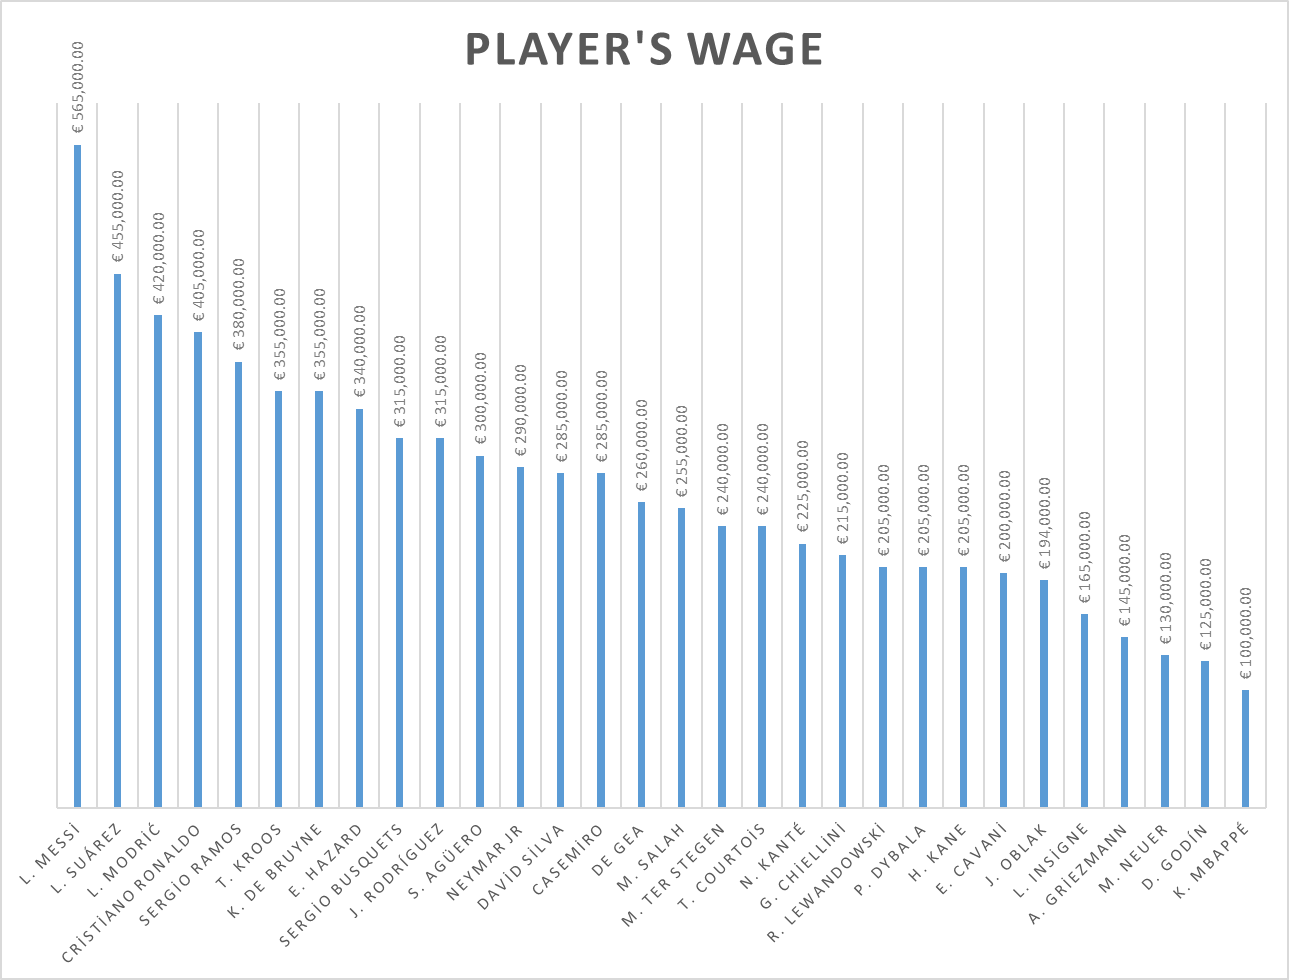
- Etkinliği tamamlayın
LO30. Solving problems requiring interpreting data represented by frequency tables or bar graphs
- Etkinliği tamamlayın
- Etkinliği tamamlayın
- Etkinliği tamamlayın
- Etkinliği tamamlayın
Comparing using bar charts
Bar graph can also be used to make comparisons.
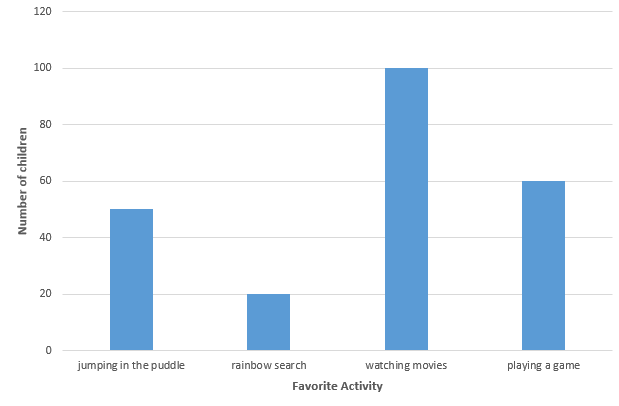
The bar graph below shows how many children chose each activity as their favorite thing to do on a rainy day.
We see that kids like to watch movies the most because the Watching Movies bar is the highest bar. We can also compare different preferences by looking at more than one bar.